A window, not a wheel
The Dashboard is read-only by design. The Human Engineer doesn't drive the run — they get up and walk away from it.
The Dashboard shows what the RL Agent is doing and what it just did. It does not let you click to assign work, retry a play, or steer an agent. If you closed the window, the run would keep going.
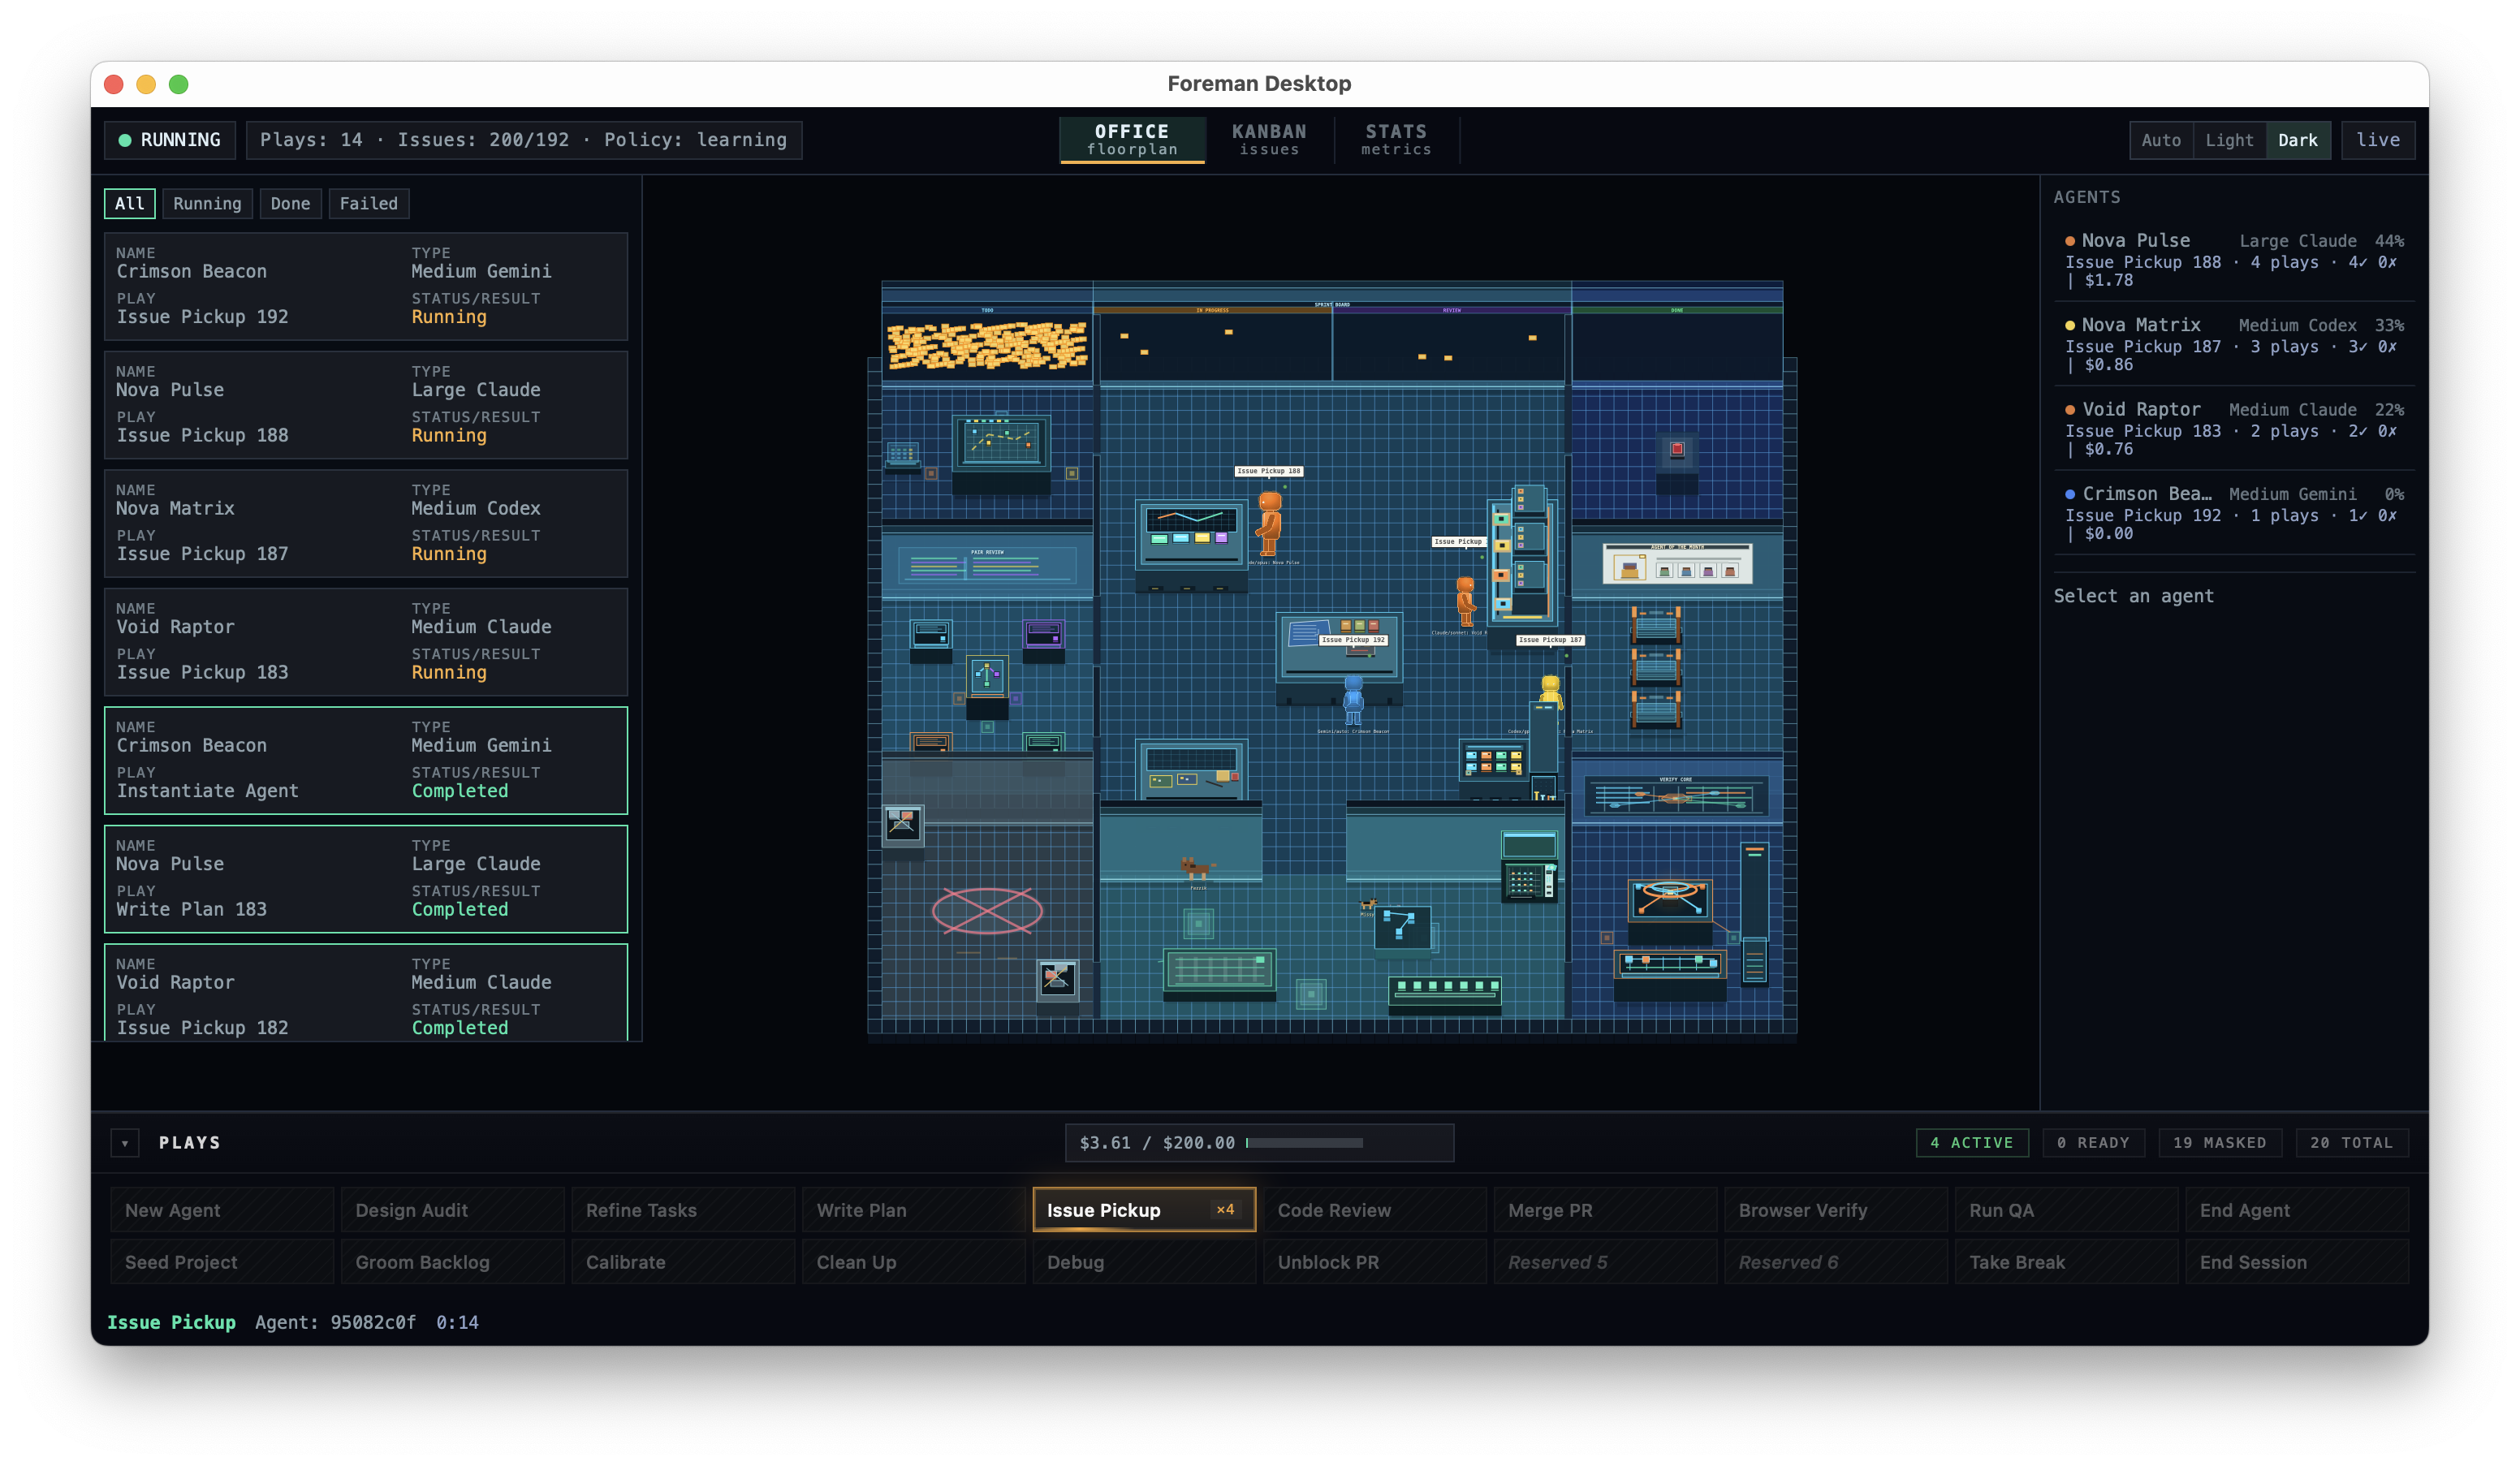
Swink AgentShore™ ships two UIs: the Dashboard (the browser-based pixel-art view — opened in your browser via agentshore dashboard from the CLI, and rendered natively inside the macOS desktop app during a running session; broken down on this page) and the TUI (a terminal companion for the same session). Both are read-only views over the same audit log — pick whichever fits where you're sitting.
The whole product is being able to leave
If the Dashboard had a "do this next" button, the Human Engineer would press it. They'd second-guess the policy, override the next play, and the RL Agent would learn to model the human's patience instead of the project's state. That's the failure mode that makes a learned manager useless.
So the Dashboard does the opposite. It shows the trajectory the policy chose, the audit trail of what each LLM Agent did, and the budget it's burning. The only controls are start the session and end the session. Everything in between is the policy's call.
The implication, working backwards: if you don't trust the run enough to walk away from it, the run isn't ready. Tighten the spec, tune the budget, or end the session. Don't sit on the Dashboard nudging it.
Six regions, one story
Each region of the Dashboard answers a different question about the run. None of them are interactive in the steering sense — you can switch views and filter the log, but you can't assign a play or override the policy.
1. Session header
The session-level facts. Whether the loop is running, how many plays have fired this session, how many issues are open against the original target, and which policy version is in charge.
2. The play log
Every play the dispatcher has run this session, newest first. Each row shows the agent name, the LLM tier it ran on, the play, and the result. Filterable by All / Running / Done / Failed. This is the audit surface — not a worklist to act on.
3. The office floorplan
A pixel-art rendering of the running session as a tiny office. Each LLM Agent is a sprite at a workstation. When an agent picks up Issue Pickup 188, the sprite walks to the sprint board and grabs a sticky. It's the same telemetry the audit log carries — just legible from across the room.
4. The agents roster
Every LLM Agent the session has spawned, with its model tier, share of total work, current play, plays-and-results count, and dollar spend. Cost is per-agent, not just session-wide — the expensive ones are easy to spot.
5. The plays palette
The 22-action catalog the RL Agent picks from each tick. The highlighted tile is the play currently dispatching. Faded tiles are masked — not legal right now, by gate or by precondition. This is the policy's action space, surfaced for inspection, not a menu the human chooses from.
6. The budget bar
Two soft caps the Human Engineer set before walking away: a dollar cap and a wall-clock time cap, either one optional. The bar shows spend against the dollar cap and time left against the clock, with the meter filling toward whichever is closer to its limit. When either cap is reached, every play except End Session and approved budget-adjustment paths is masked — the session stops taking on new work and winds down on its own while in-flight agents finish.
Things the Dashboard intentionally doesn't do
The negative space is the design. A handful of features that would feel natural on a project dashboard are deliberately absent.
- No "assign this play" button. The RL Agent picks. If you want a different play to fire, change the policy weights or the gates, not the click target.
- No "retry" on a failed play. Failures are observations the policy needs to see. Retry is itself a play the policy may choose, on its terms.
- No agent steering. Selecting an agent shows its trajectory. It doesn't open a prompt box. The LLM Agents take direction from the dispatched play, not from you.
- No "approve this PR" workflow. PR review lives in GitHub. The Dashboard reports the audit; it doesn't host the merge.
- No edit-the-spec affordance. The spec is upstream of the session. Edit it in the repo, then start a new run.
What a real walk-away looks like
The Dashboard is built around one workflow, run on most evenings:
- Set the budget and time caps and start the session. The Human Engineer is at the keyboard for sixty seconds.
- Walk away. Dinner, a movie, sleep, the day job. The Dashboard keeps rendering, but no one is watching.
- The policy works the backlog. Pick an issue, write a plan, open a PR, run cross-framework review, merge, repeat. Hard gates catch the things that must never happen.
- The session ends on its own. Either the queue is drained, the dollar or time cap is hit, or End Session was scheduled. The Dashboard freezes in its last state.
- The Human Engineer comes back to the audit. The play log, the merged PRs, the closed issues, the spend. Decide what to spec for the next run.
If a session needs someone watching it, that's a signal — the spec was under-defined, the budget was too generous, or the gates didn't cover something they should have. The fix is upstream of the Dashboard, not in it.
The deeper rule
A read-only Dashboard is the honest one. Once you give a learned manager a manual override, you're back to a chat-style assistant with a fancier theme — and the policy stops being the manager. The Dashboard exists so the Human Engineer can trust the run, not steer it. The TUI sibling makes the same promise from a terminal. The whole point of AgentShoring is the walk.