Effort that tracks the backlog
Multiple harnesses run against one backlog at once. How many agents are working, and how hard the session is pushing, rises and falls with the real state of the graph, not a fixed schedule.
Reading the timeline
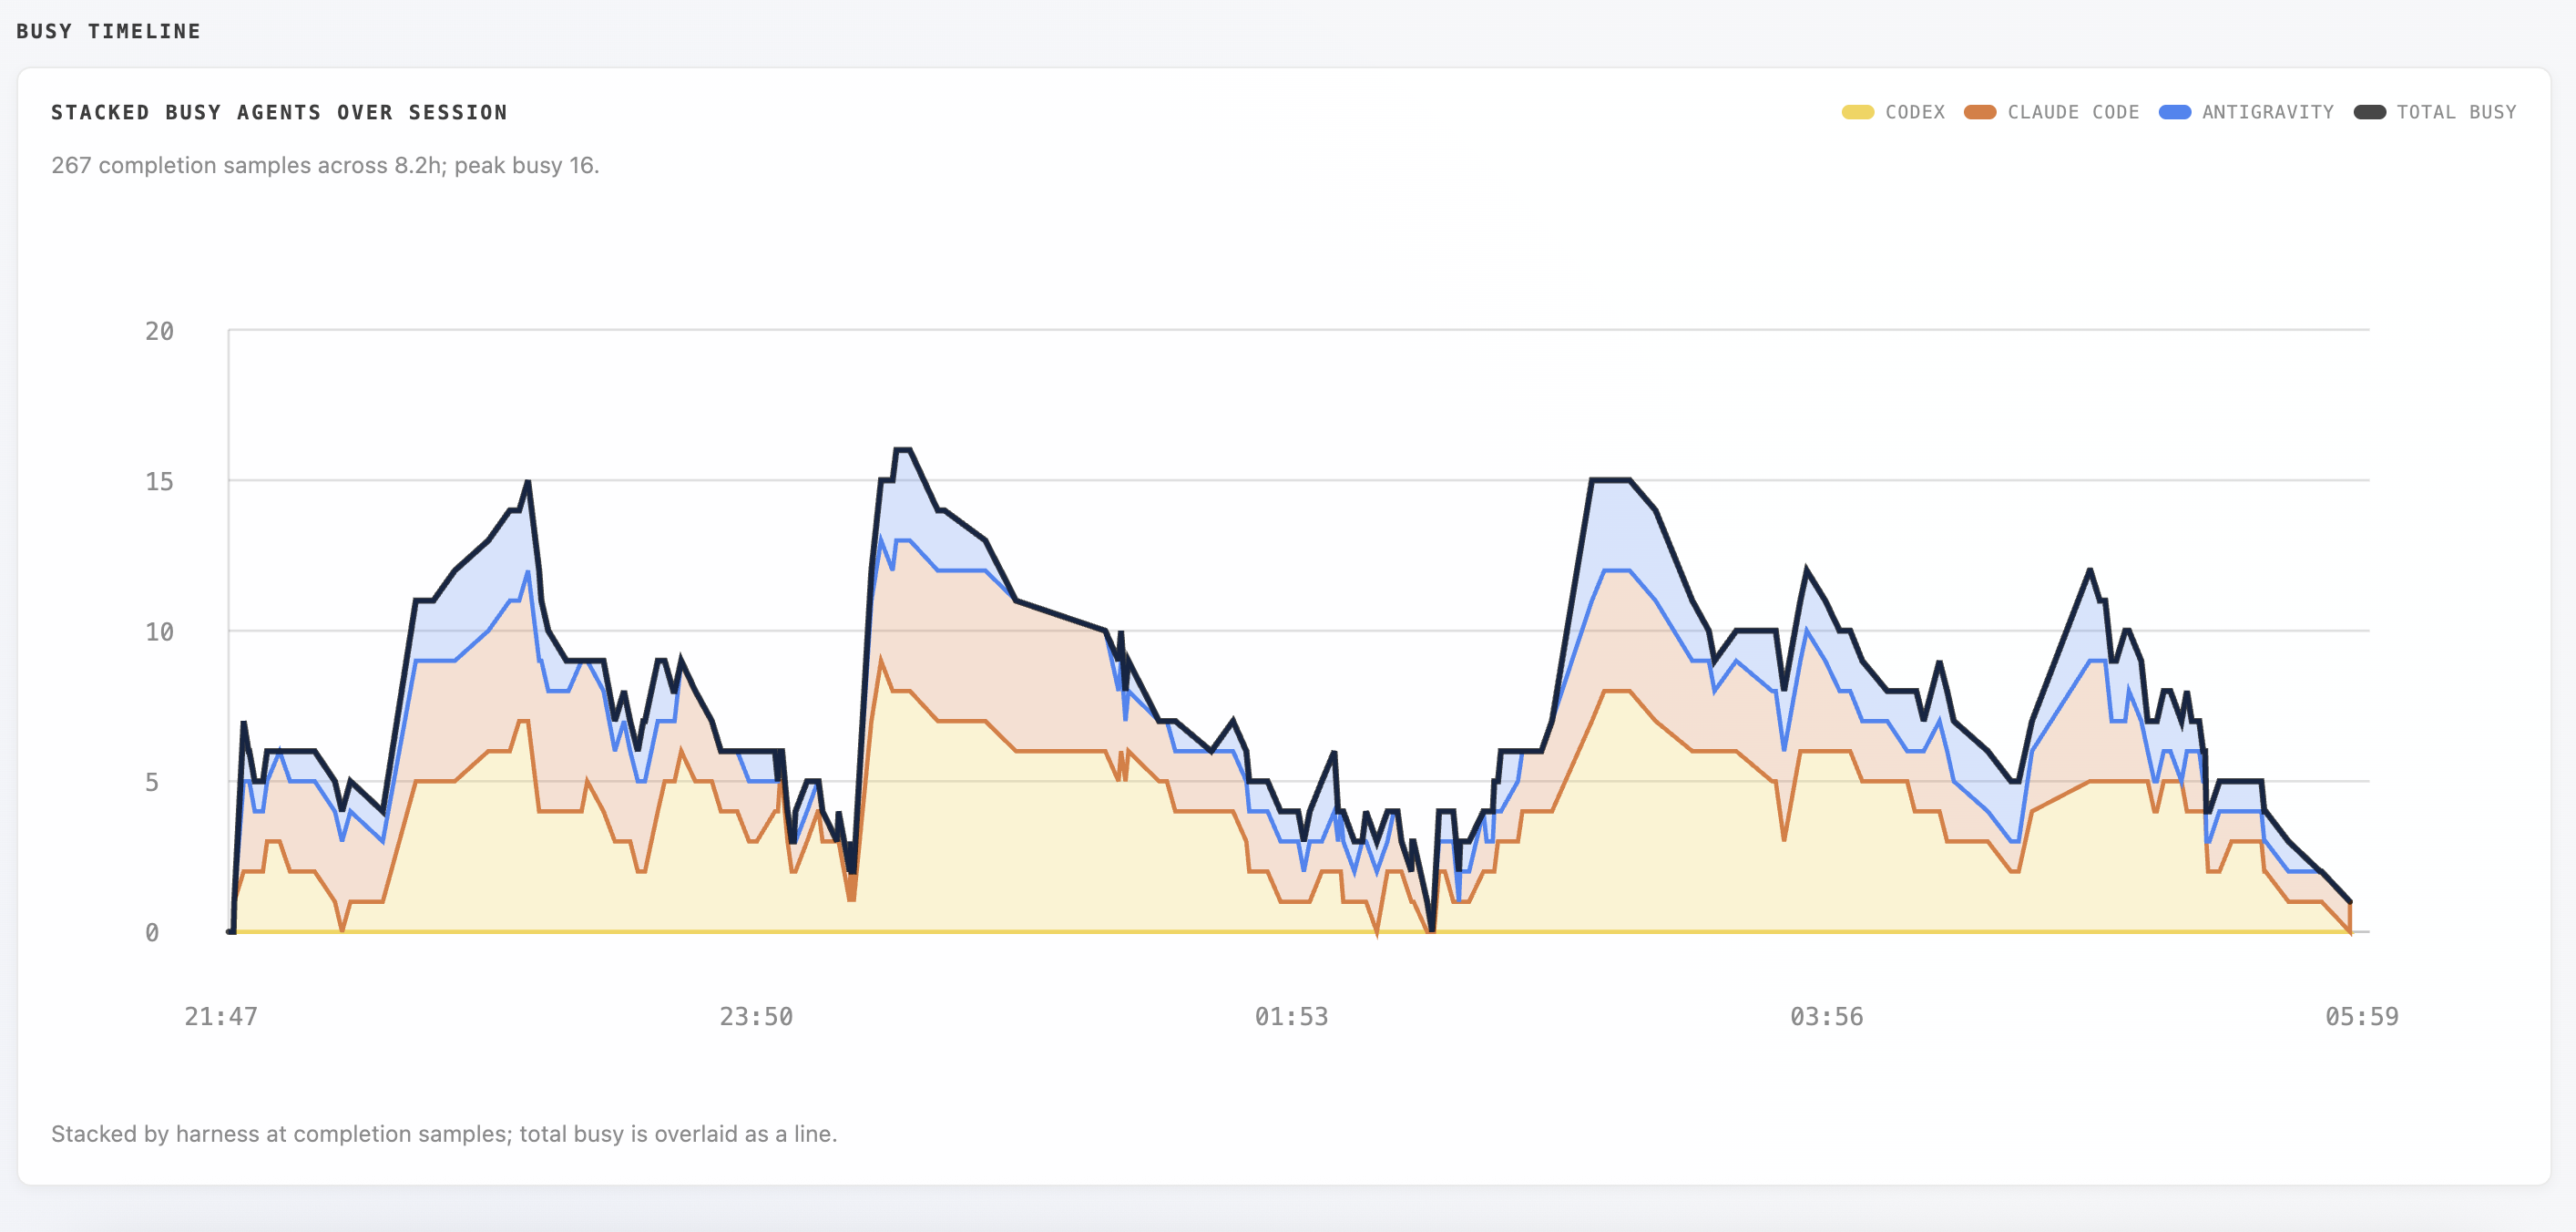
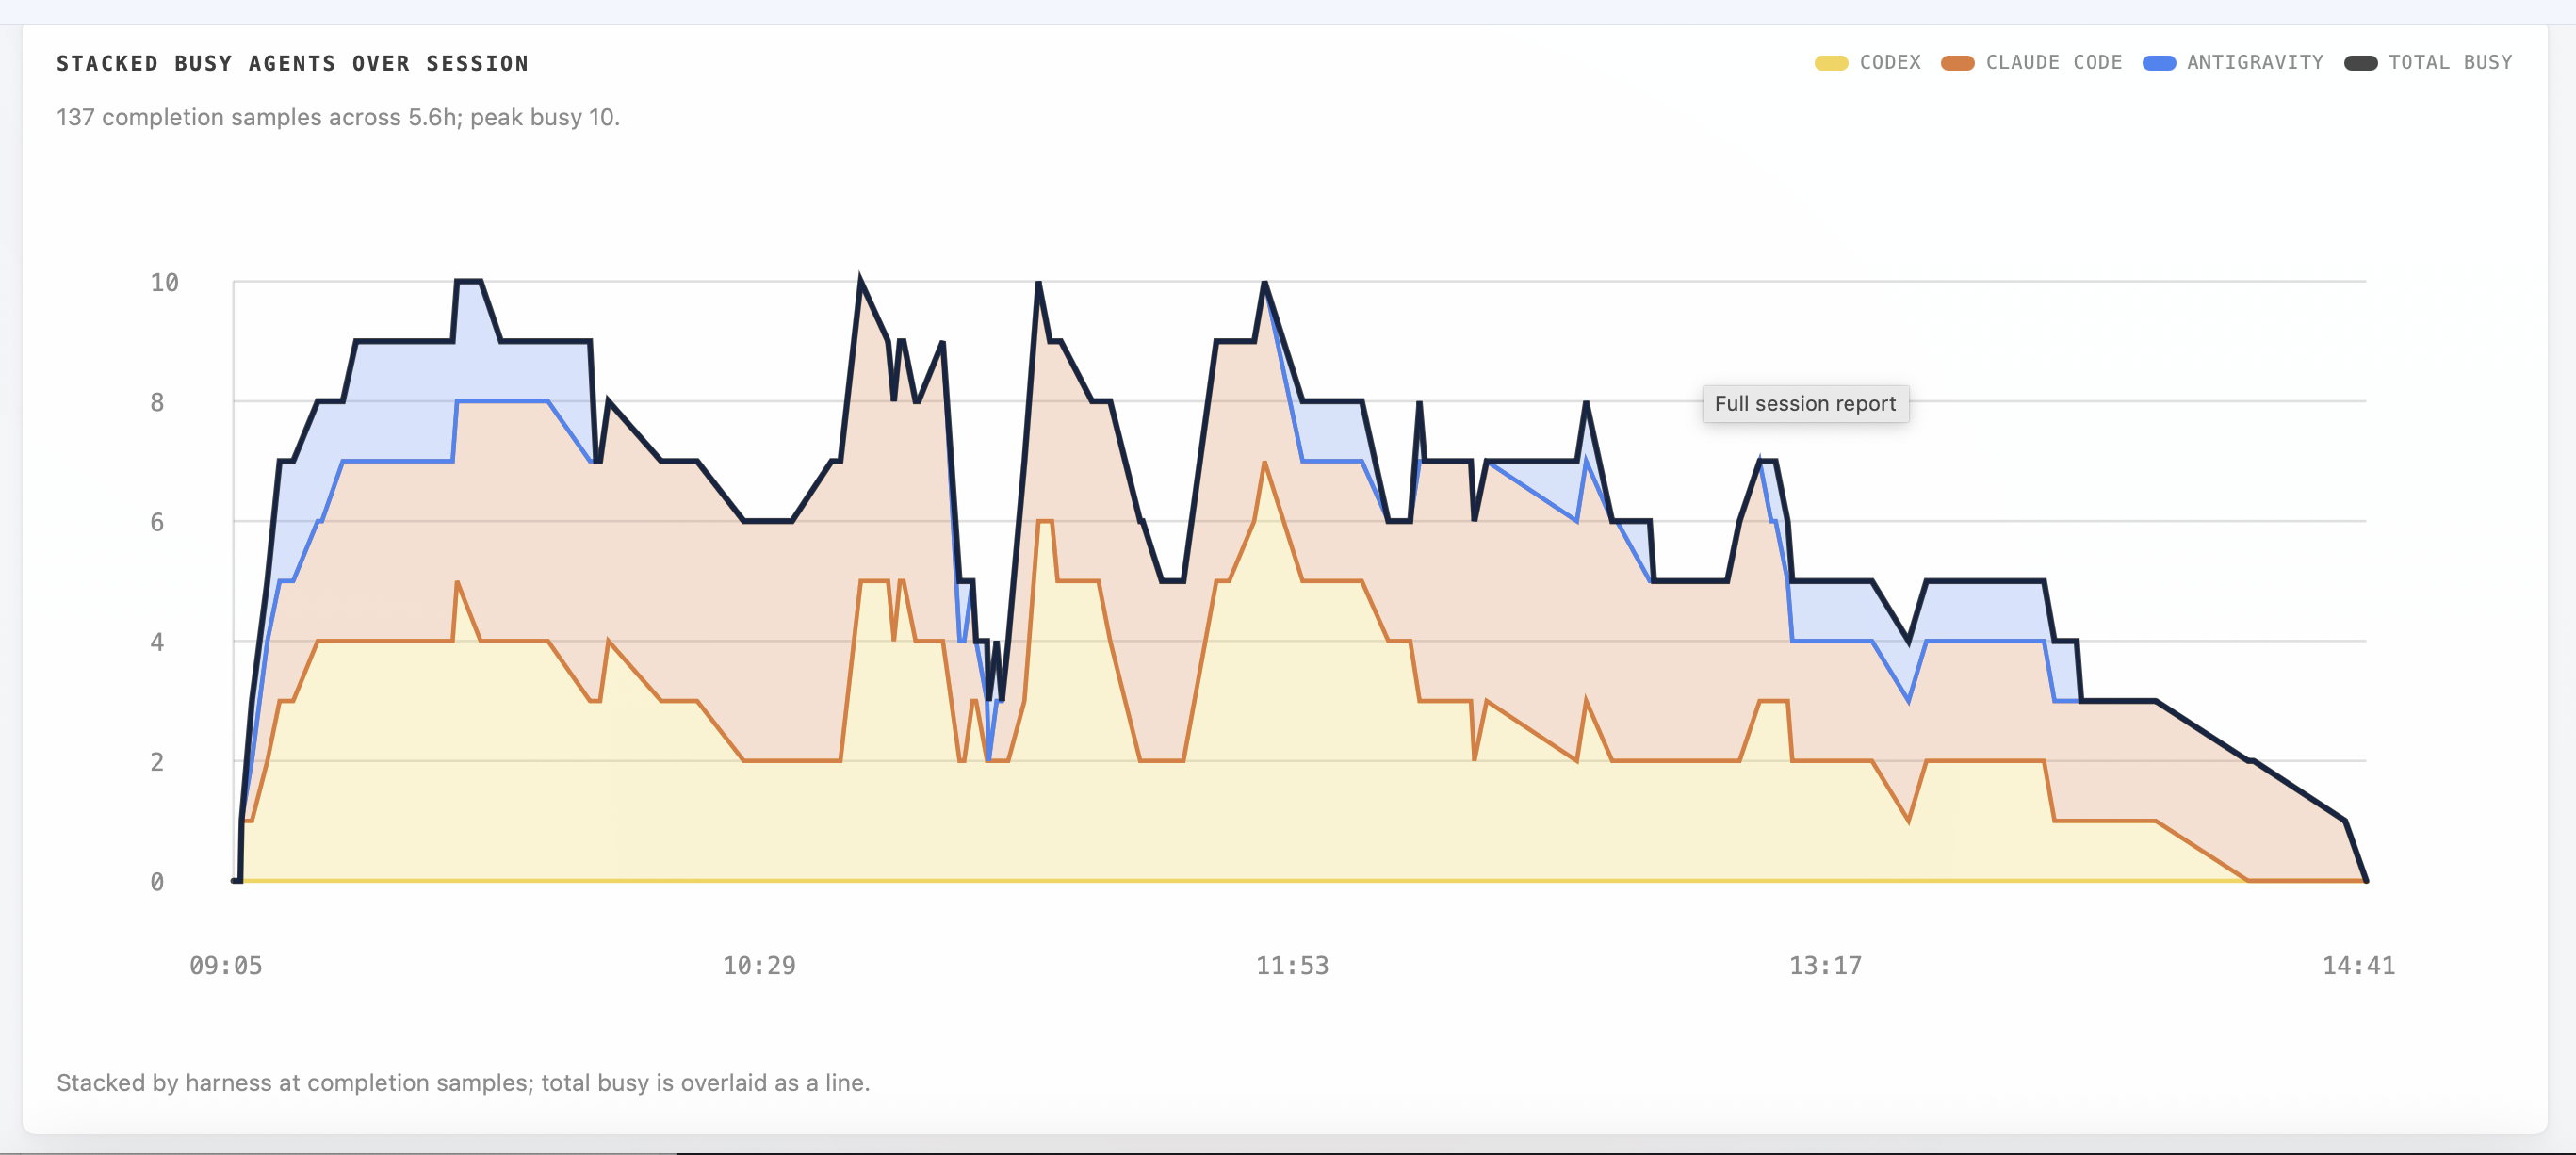
Every time an LLM Agent finishes a play, the session records how many agents were busy at that moment, split by which harness each one was running on. Those samples stack into bands; the dark line on top is the total busy count.
Read vertically, a tall stack means many agents were working the backlog in parallel right then. Read horizontally, the rise and fall is the policy responding to the state of the project graph over the night.
The fleet for this run
The fleet is declared in agentshore.yaml and surfaced at session setup. For this run, three runners were enabled (Antigravity, Claude Code, and Codex CLI) and Grok was left off. Each runner is allotted a mix of Small, Medium, and Large agents, the tiers the policy draws from when it sizes a play to the work.
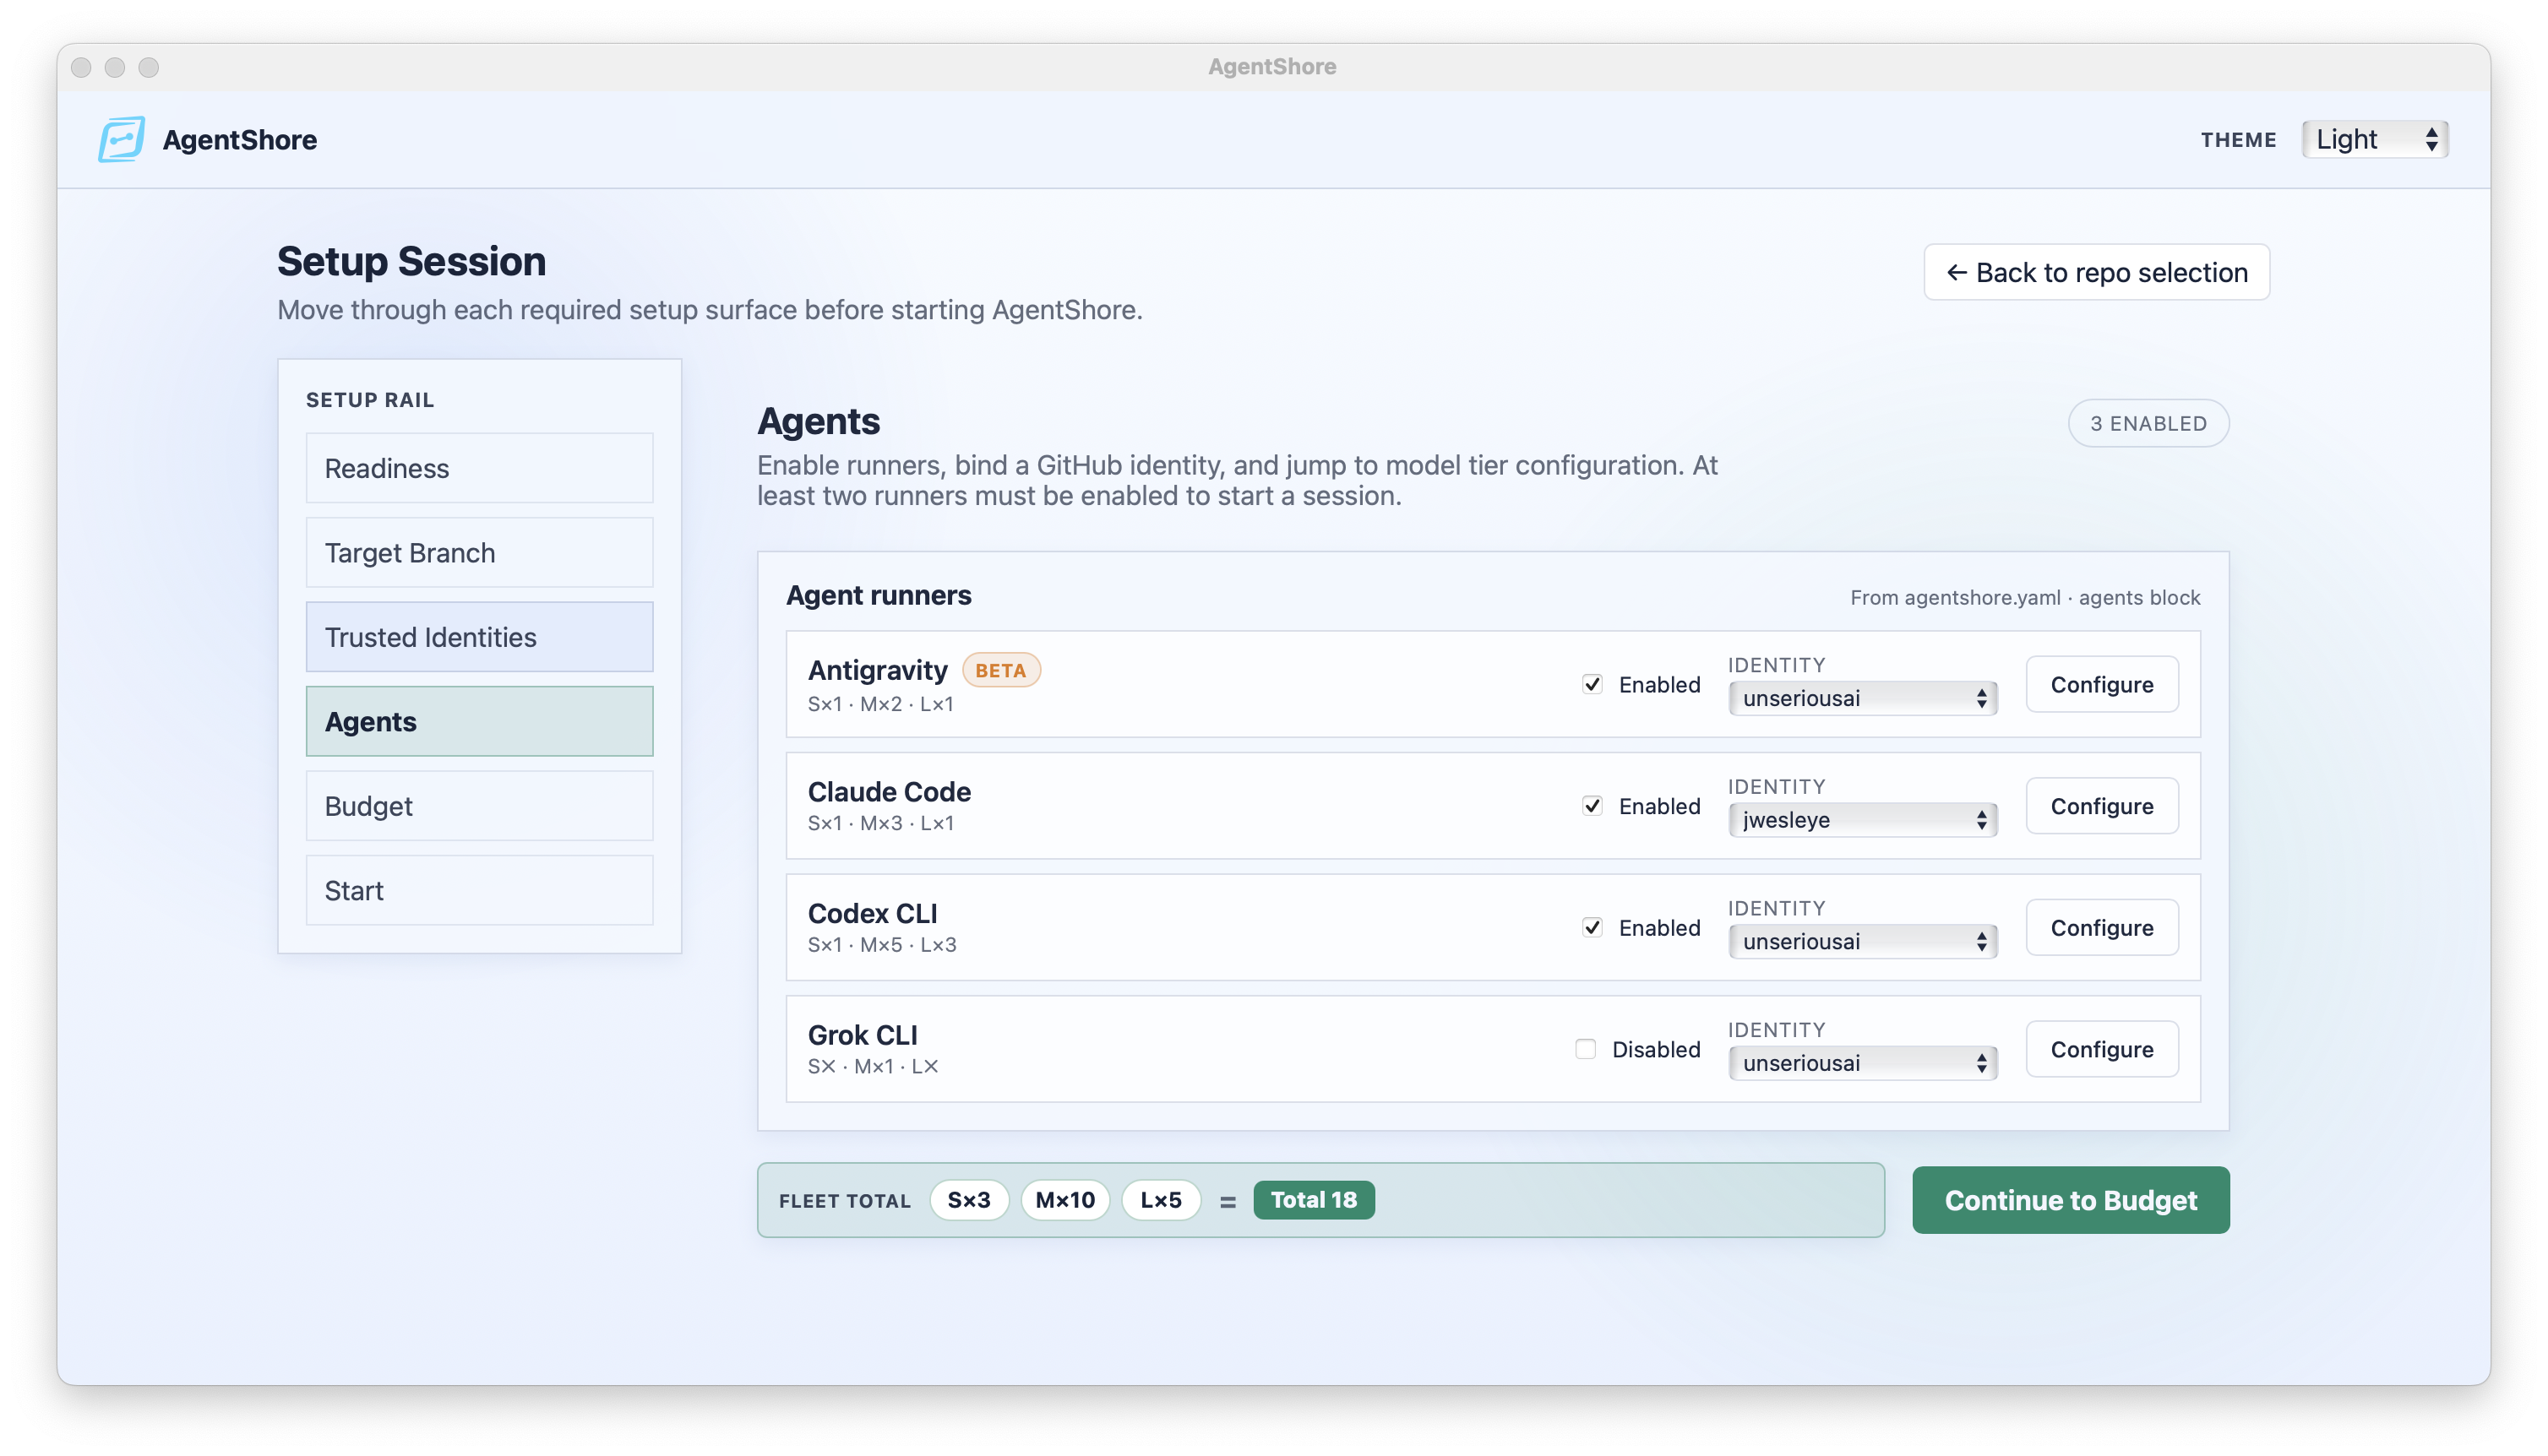
That fleet total, 18 agents, is the ceiling for the night. The run peaked at 16 because the backlog never had enough size-matched work to fill all 18 slots at once: a Large slot only runs when there's Large-sized work ready for it, so the mix of pickable work topped out two short of the cap.
Why it isn't a flat line
Concurrency is bounded by parallelizable work, not by a fixed worker count. Even with 18 agents available, most of the night runs well below the cap. The level of effort follows the backlog: when issues are groomed and pickable, the policy spins up agents toward the fleet limit; when the graph is blocked (work waiting on review, a merge train, or a backlog that needs grooming before anything else can move), there's nothing safe to dispatch, and concurrency falls away.
The deep valley back to zero around 01:53 is that: a moment where the next move was a single serial play (a reconcile or a groom) before parallel work opened back up. The policy isn't idling on purpose; it's waiting for the graph to give it something it's allowed to run.
Three harnesses share the floor
The bands aren't all one model. A single run mixes Codex, Claude Code, and Antigravity agents on the same backlog. That's not for variety; it's the substrate that lets cross-framework review hold: the agent that authors a change and the agent that reviews it run on different families, enforced as identity, not preference.
So a tall stack is also a mix: several harnesses working the same project at once, and the review of any one change is structurally guaranteed to come from a different family than the author. When the stack is short, that mix is still there, just fewer of each, because the backlog asked for less.
What the shape tells you
A flat, always-maxed line would mean the system was ignoring the graph and just keeping workers busy. A line that never rises would mean it couldn't parallelize at all. This shape, climbing when work piles up and collapsing honestly when it runs out, is the PPO policy tracking real eligibility: dispatch when there's safe parallel work, back off when there isn't, and do it for 8.2 hours with no one watching.
You can watch the same thing live in the Dashboard or the TUI. This page is what it looks like after the run, in one frame.
Different runs, different concurrency
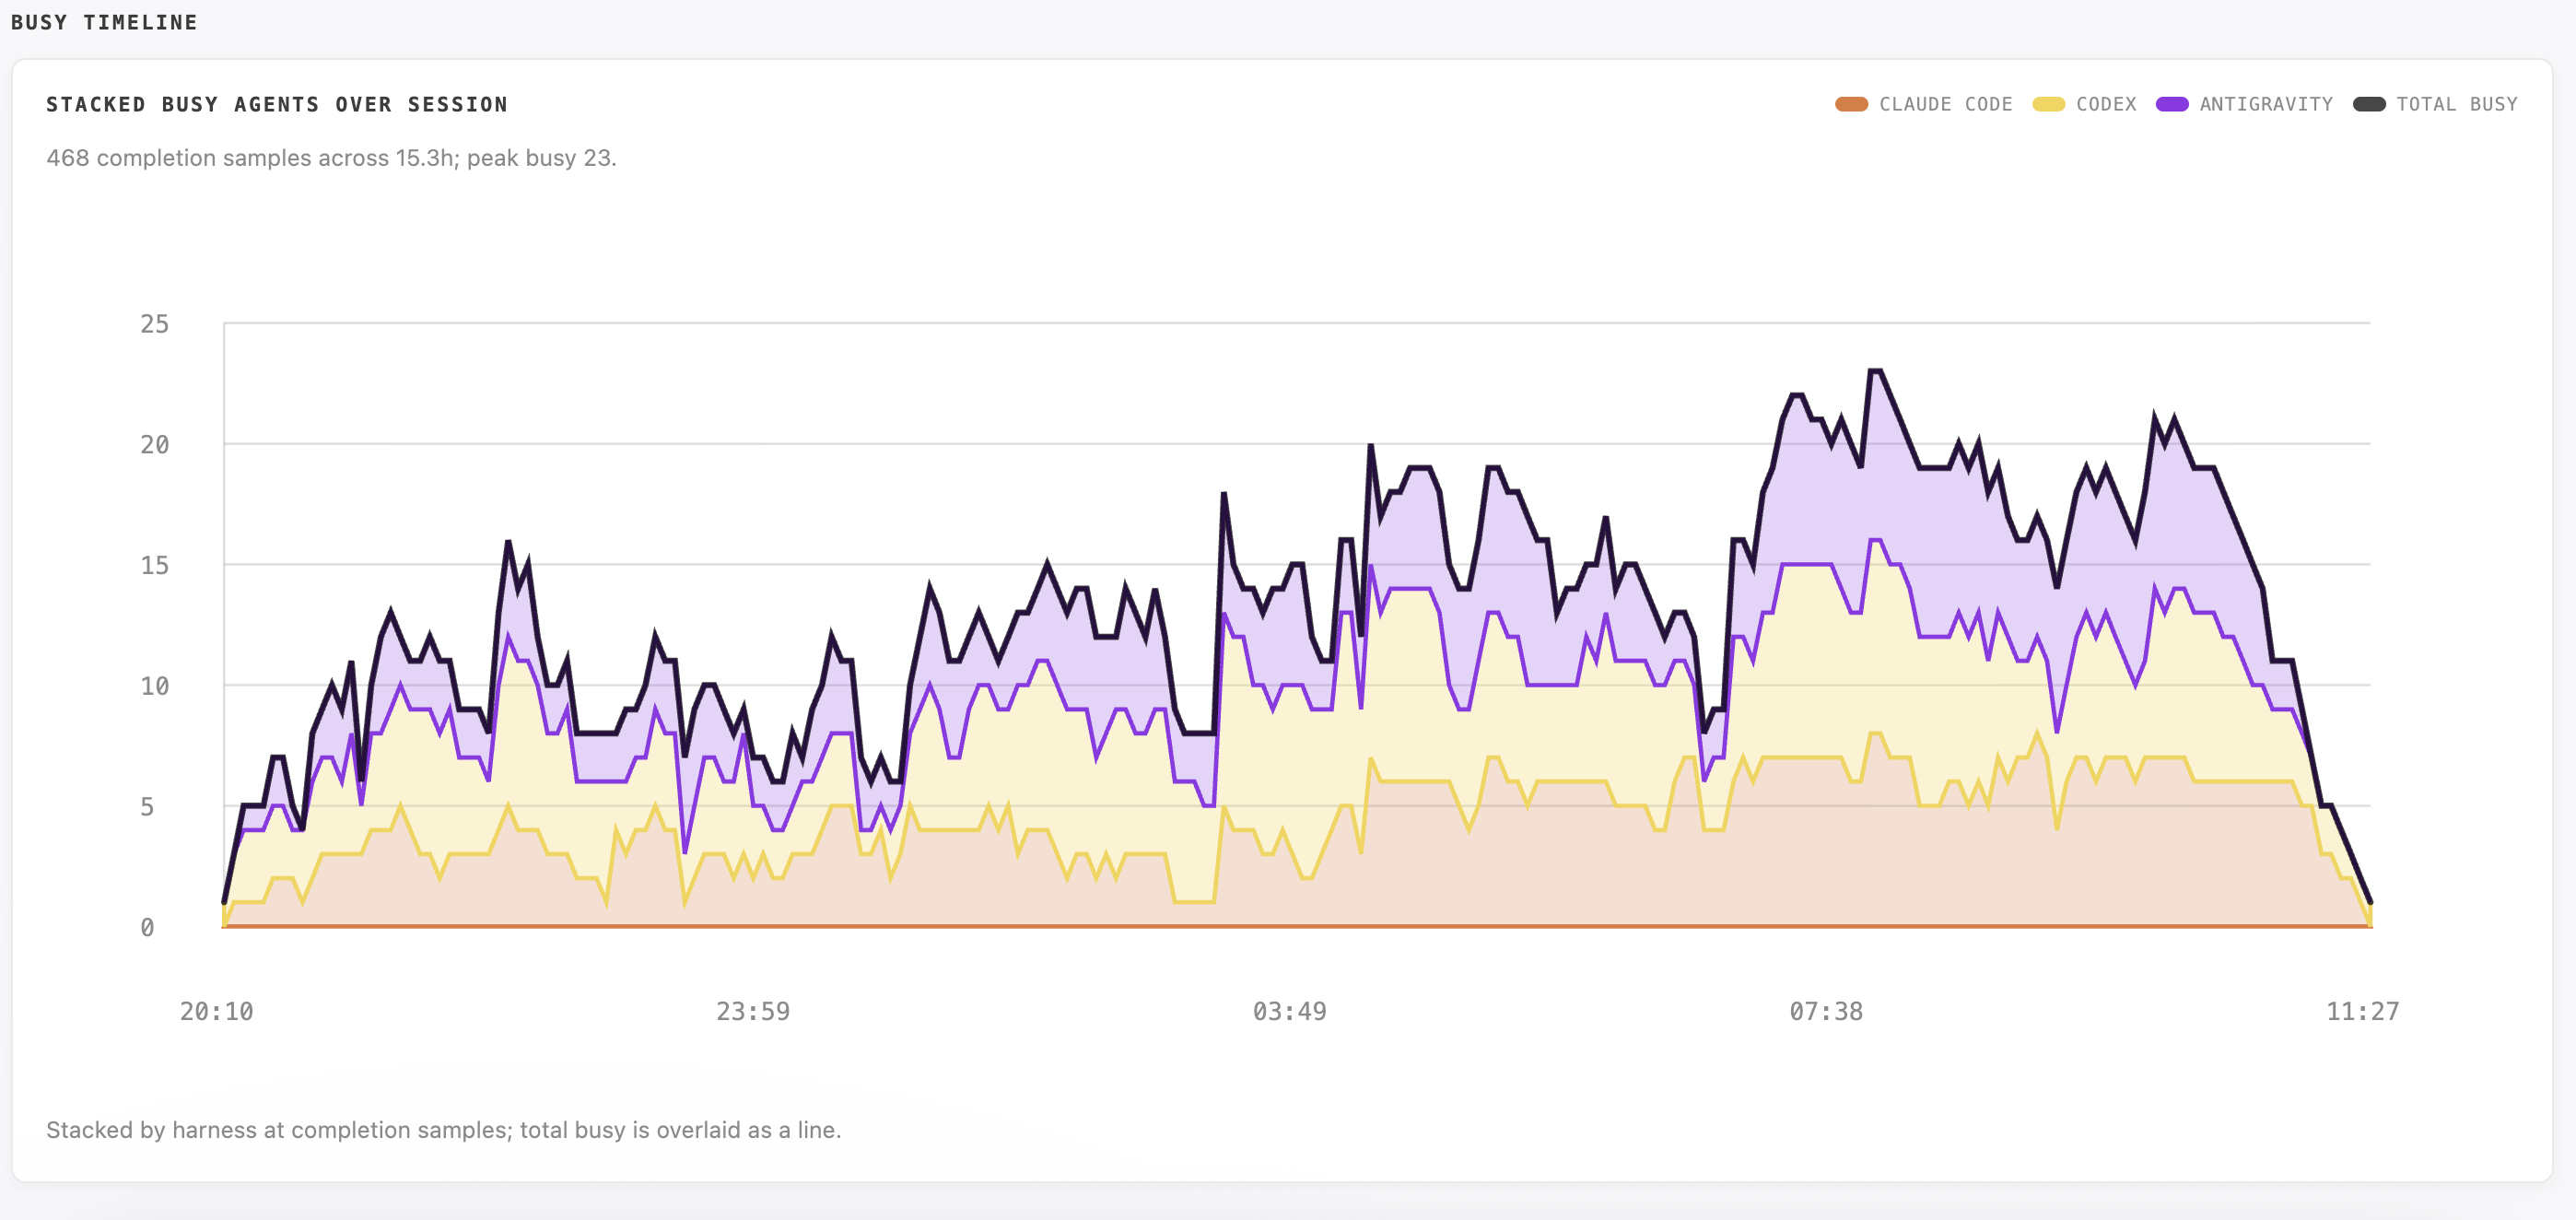
No two runs look the same. The shape is a fingerprint of the backlog, the fleet, and how much of the work could run in parallel at the time. Two more sessions, the same read-only chart:
Watch it live, too
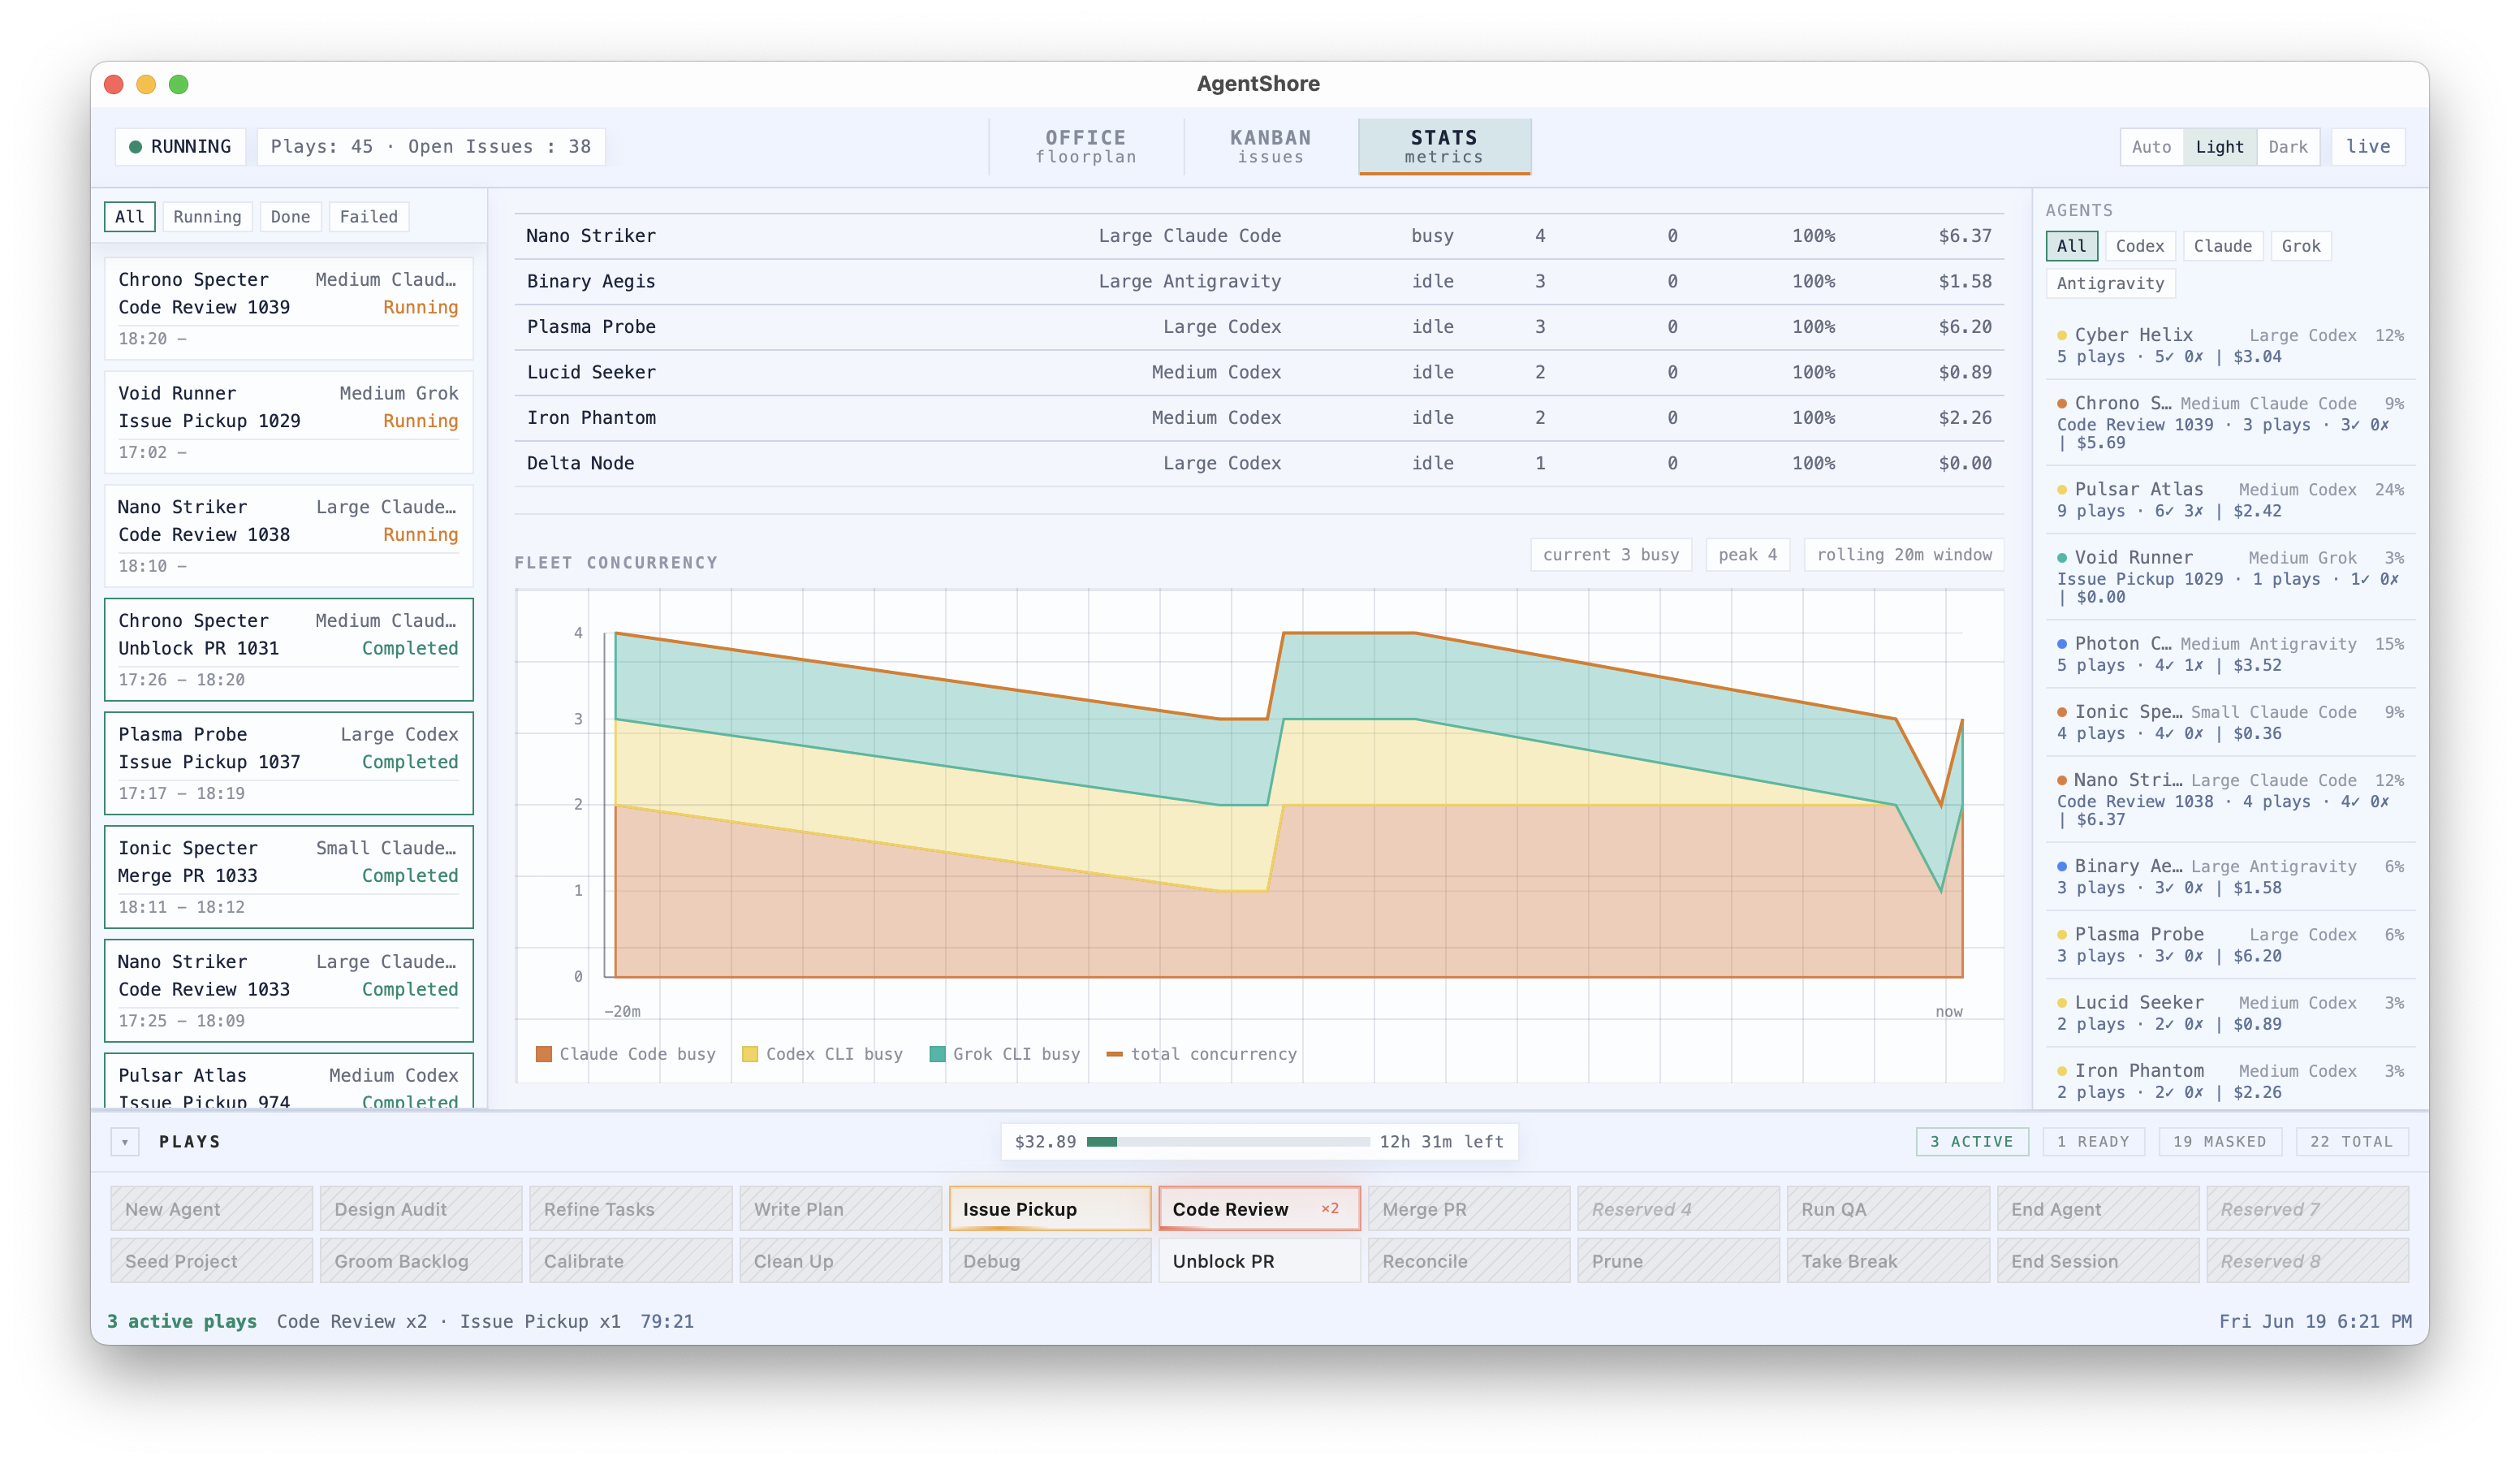
This page is the after-the-fact view. The same concurrency is visible in real time in the Dashboard, under the Stats tab: a rolling-window Fleet Concurrency chart stacked by harness, with current and peak busy counts beside the per-agent metrics.